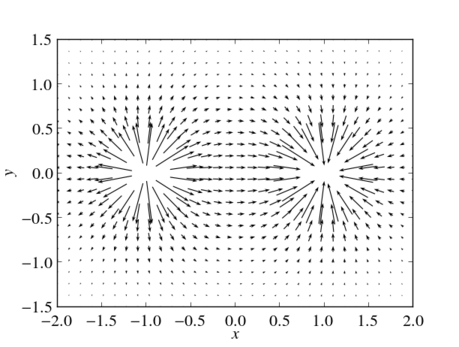
In this collaboration with Dr. Stanislas Pierre Maximilien Grare in PHY104 (Electrical Physics), I studied electric fields, electric charge and electromagnetism as the groundwork for a visualized experiment. Together we worked out how to use plotting libraries in Jupyter Notebook, using SciPy and Matplotlib to visualize electric fields and the direction of electric charges.
For anyone who wants to build visualizations like these, both Google Colab and Visual Studio Code are good choices. Google Colab may be the easier start, since it comes with many environments already installed.